When your Worker slows down or starts throwing errors, finding the root cause shouldn't require hours of log analysis and trial-and-error debugging. You should have clear visibility into what's happening at every step of your application's request flow. This is feedback we’ve heard loud and clear from developers using Workers, and today we’re excited to announce an Open Beta for tracing on Cloudflare Workers! You can now:
-
Get automatic instrumentation for applications on the Workers platform: No manual setup, complex instrumentation, or code changes. It works out of the box.
-
Explore and investigate traces in the Cloudflare dashboard: Your traces are processed and available in the Workers Observability dashboard alongside your existing logs.
-
Export logs and traces to OpenTelemetry-compatible providers: Send OpenTelemetry traces (and correlated logs) to your observability provider of choice.
In 2024, we set out to build the best first-party observability of any cloud platform. We launched a new metrics dashboard to give better insights into how your Worker is performing, Workers Logs to automatically ingest and store logs for your Workers, a query builder to explore your data across any dimension and real-time logs to stream your logs in real time with advanced filtering capabilities. Starting today, you can get an even deeper understanding of your Workers applications by enabling automatic tracing!
What is Workers Tracing?
Workers traces capture and emit OpenTelemetry-compliant spans to show you detailed metadata and timing information on every operation your Worker performs. It helps you identify performance bottlenecks, resolve errors, and understand how your Worker interacts with other services on the Workers platform. You can now answer questions like:
-
Which calls are slowing down my application?
-
Which queries to my database take the longest?
-
What happened within a request that resulted in an error?
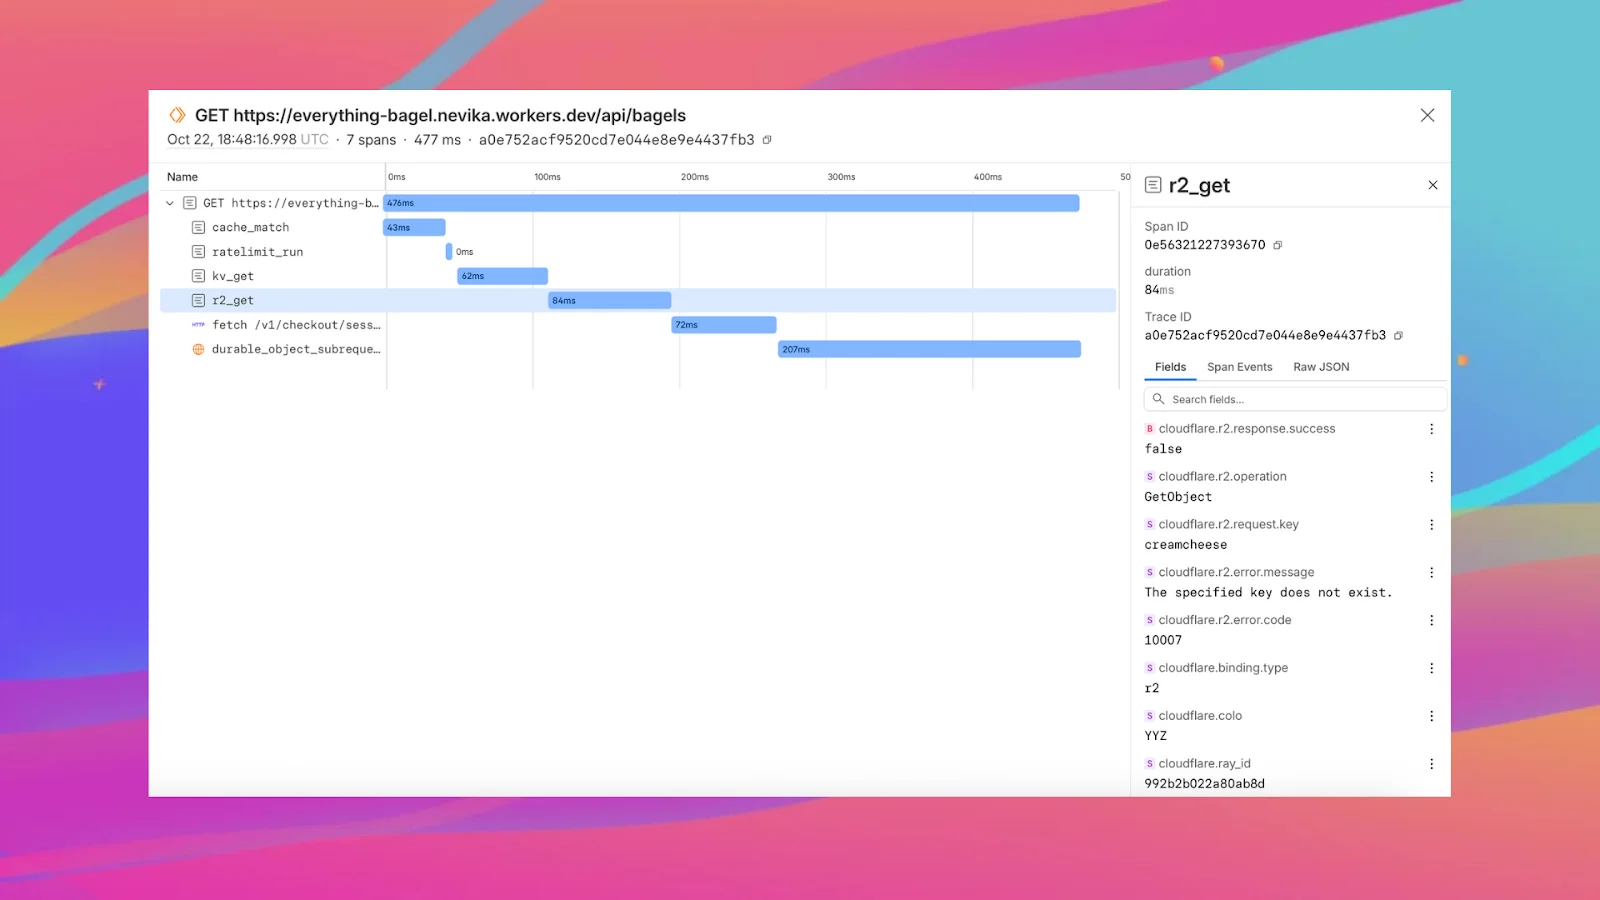
Tracing provides a visualization of each invocation's journey through various operations. Each operation is captured as a span, a timed segment that shows what happened and how long it took. Child spans nest within parent spans to show sub-operations and dependencies, creating a hierarchical view of your invocation’s execution flow. Each span can include contextual metadata or attributes that provide details for debugging and filtering events.
Full automatic instrumentation, no code changes
Previously, instrumenting your application typically required an understanding of the OpenTelemetry spec, multiple OTel libraries, and how they related to each other. Implementation was tedious and bloated your codebase with instrumentation code that obfuscated your application logic.
Setting up tracing typically meant spending hours integrating third-party SDKs, wrapping every database call and API request with instrumentation code, and debugging complex config files before you saw a single trace. This implementation overhead often makes observability an afterthought, leaving you without full visibility in production when issues arise.
What makes Workers Tracing truly magical is it’s completely automatic – no set up, no code changes, no wasted time. We took the approach of automatically instrumenting every I/O operation in your Workers, through a deep integration in workerd, our runtime, enabling us to capture the full extent of data flows through every invocation of your Workers.
You focus on your application logic. We take care of the instrumentation.
What you can trace today
The operations covered today are:
-
Binding calls: Interactions with various Worker bindings. KV reads and writes, R2 object storage operations, Durable Object invocations, and many more binding calls are automatically traced. This gives you complete visibility into how your Worker uses other services.
-
Fetch calls: All outbound HTTP requests are automatically instrumented, capturing timing, status codes, and request metadata. This enables you to quickly identify which external dependencies are affecting your application's performance.
-
Handler calls: Methods on a Worker that can receive and process external inputs, such as fetch handlers, scheduled handlers, and queue handlers. This gives you visibility into performance of how your Worker is being invoked.
Automatic attributes on every span
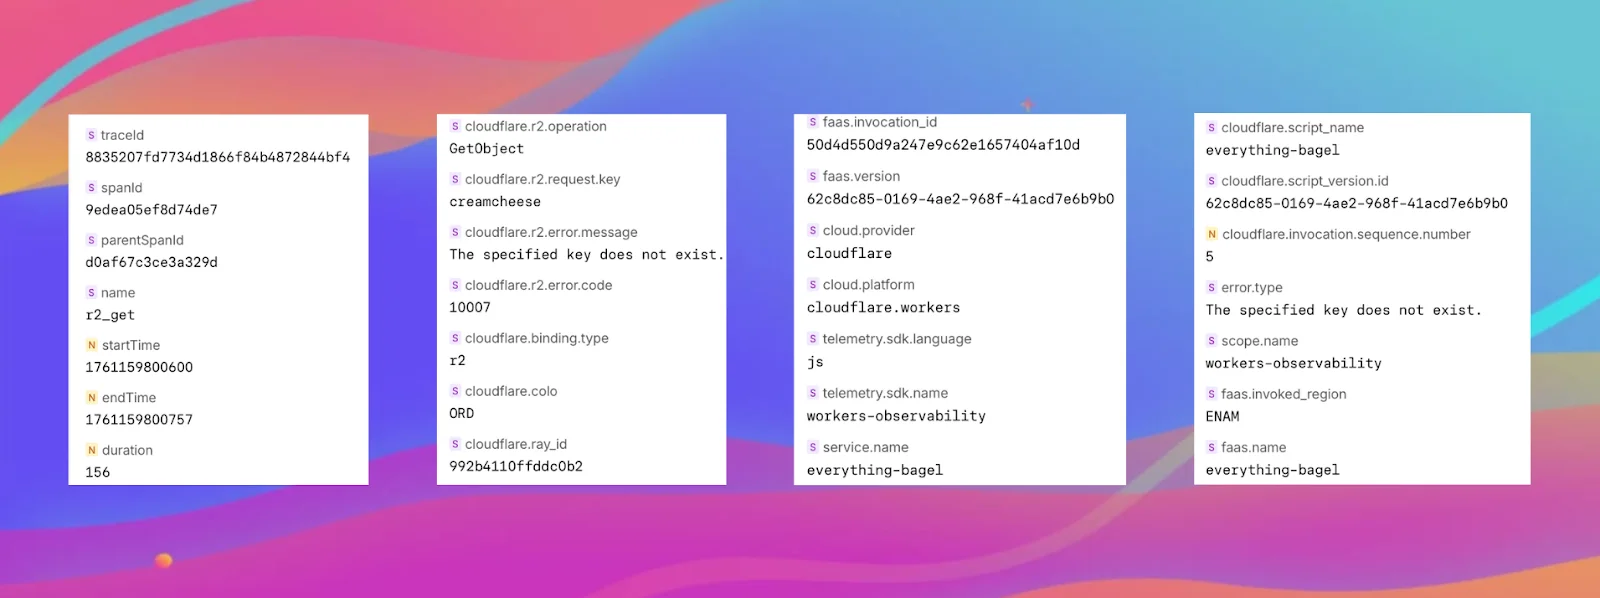
Our automated instrumentation captures each operation as a span. For example, a span generated by an R2 binding call (like a get or put operation) will automatically contain any available attributes, such as the operation type, the error if applicable, the object key, and duration. These detailed attributes provide the context you need to answer precise questions about your application without needing to manually log every detail.
We will continue to add more detailed attributes to spans and add the ability to trace an invocation across multiple Workers or external services. Our documentation contains a complete list of all instrumented spans and their attributes.
Investigate traces in the Workers dashboard
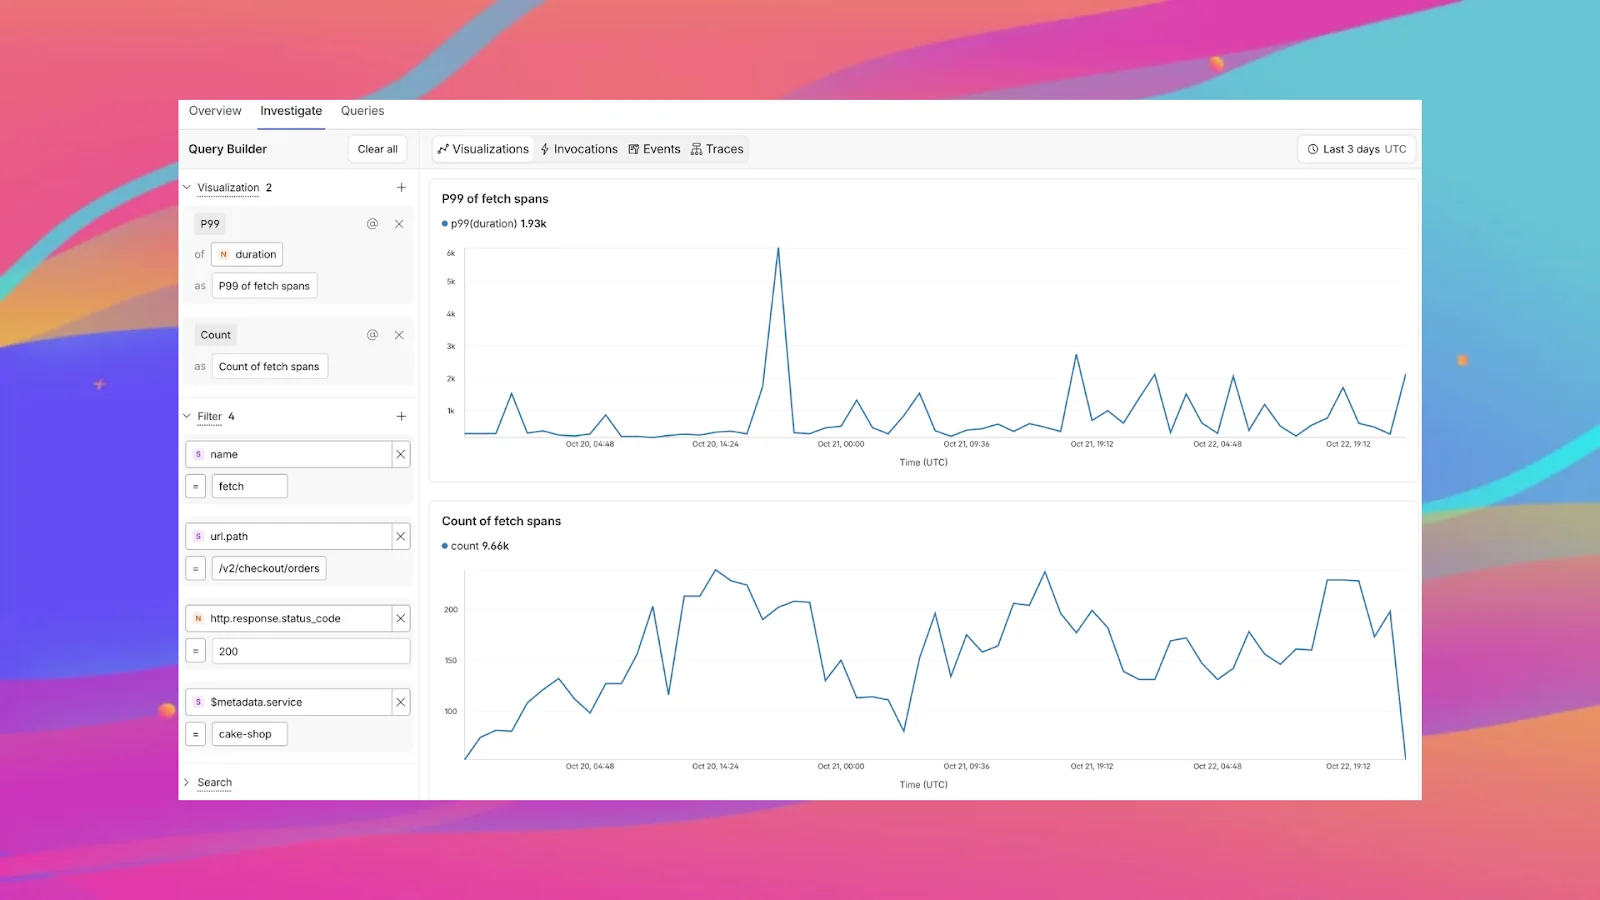
You can easily view traces directly within a specific Worker application in the Cloudflare dashboard, giving you immediate visibility into your application's performance. You’ll find a list of all trace events within your desired time frame and a trace visualization of each invocation including duration of each call and any available attributes. You can also query across all Workers on your account, letting you pinpoint issues occurring on multiple applications.
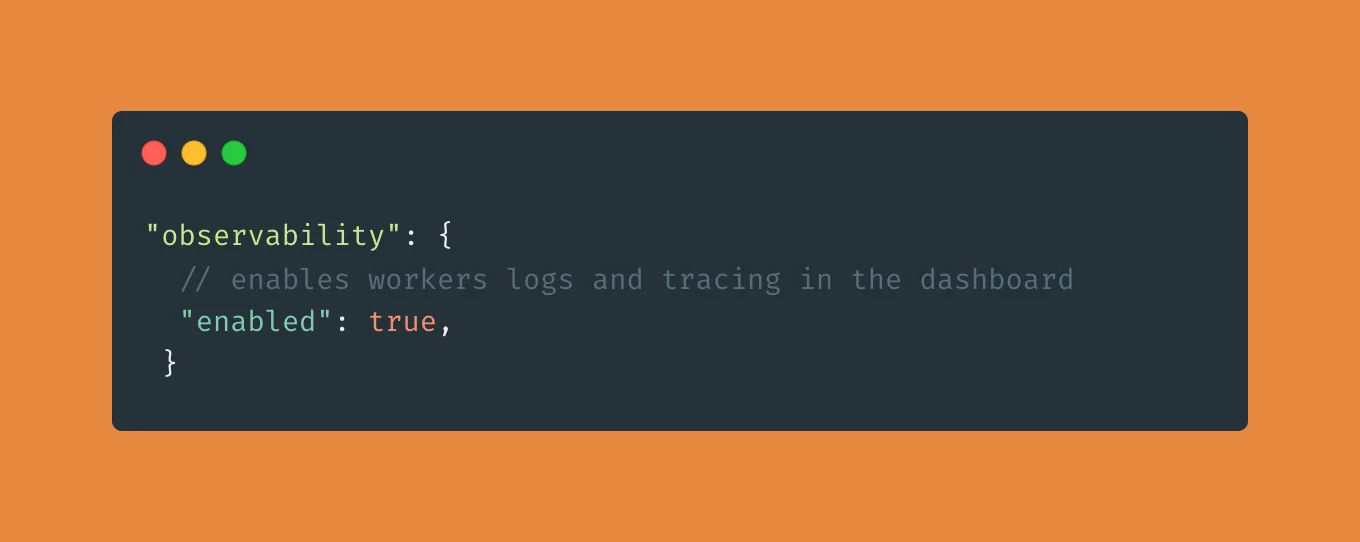
To get started viewing traces on your Workers application, you can set:
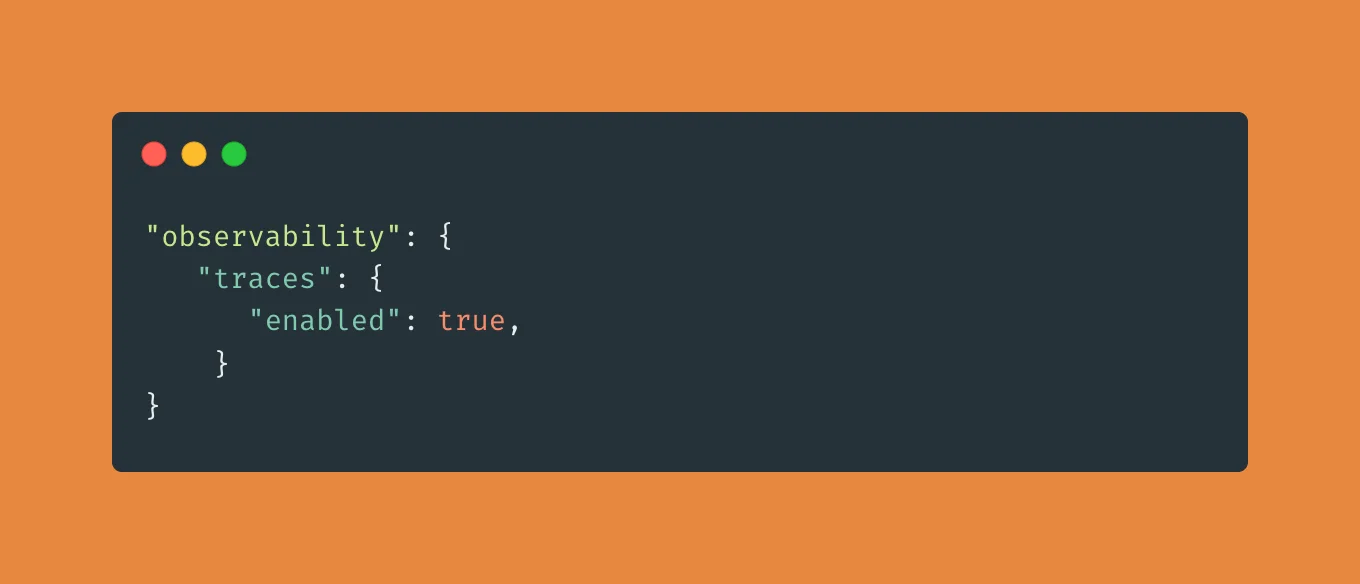
Or if you already have observability.enabled=true configured, traces will be automatically emitted alongside your logs.
Export traces to OpenTelemetry compatible providers
However, we realize that some development teams need Workers data to live alongside other telemetry data in the tools they are already using. That’s why we’re also adding tracing exports, letting your team send, visualize and query data with your existing observability stack! Starting today, you can export traces directly to providers like Honeycomb, Grafana, Sentry or any other OpenTelemetry Protocol (OTLP) provider with an available endpoint.
Correlated logs and traces
We also support exporting OTLP-formatted logs that share the same trace ID, enabling third-party platforms to automatically correlate log entries with their corresponding traces. This lets you easily jump between spans and related log messages.
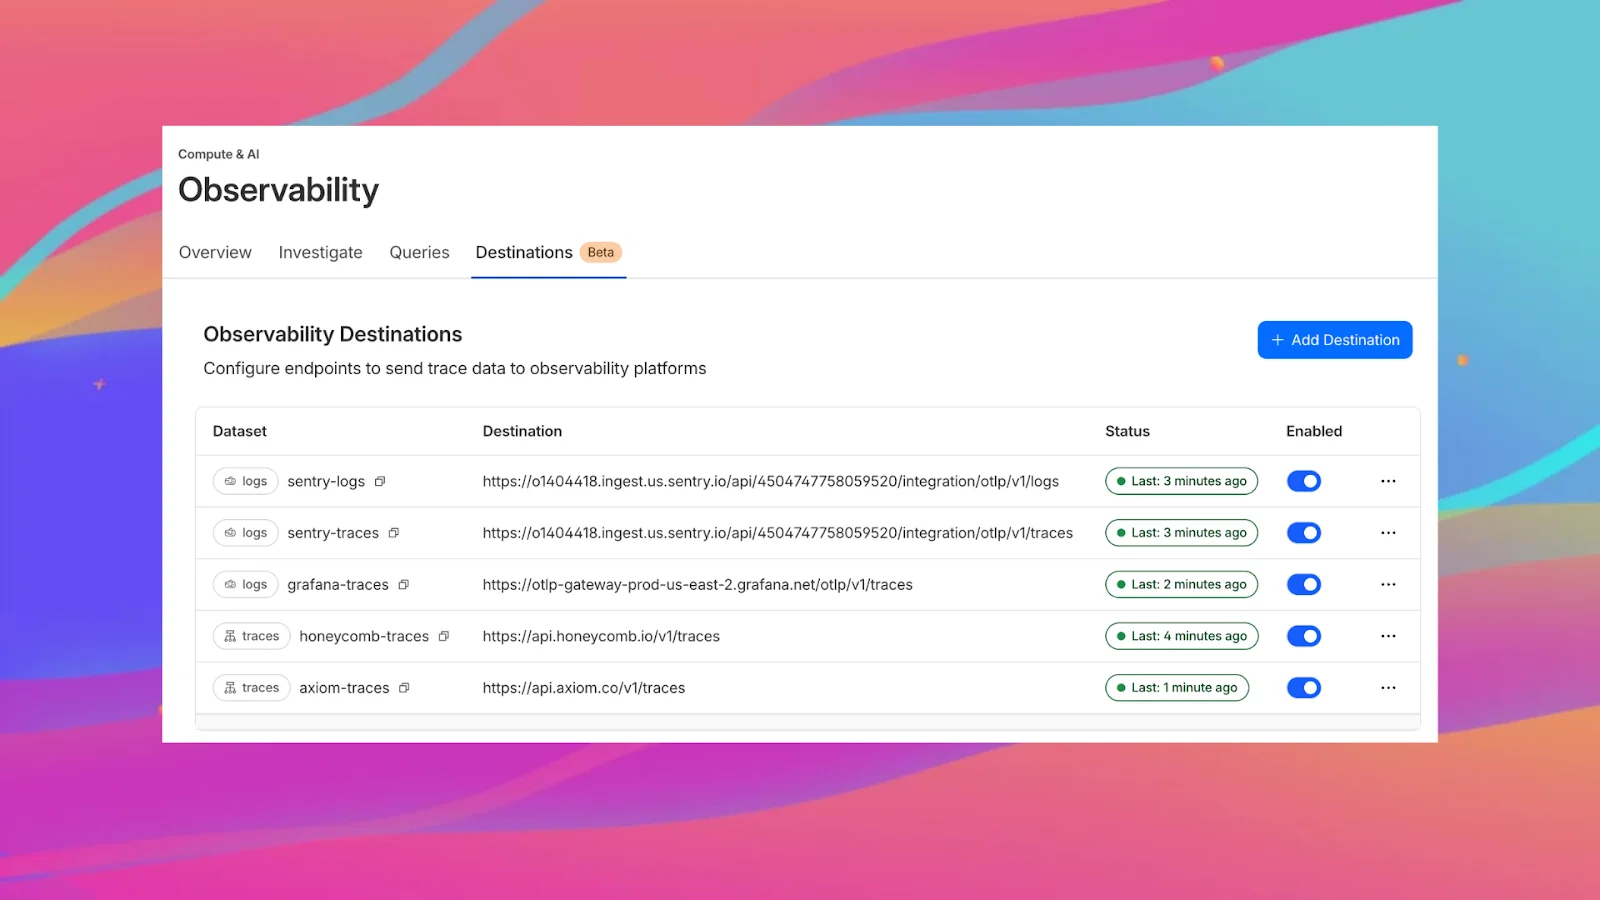
Set up your destination, enable exports, and go!
Чтобы начать отправку событий в выбранное место назначения, сначала настройте конечную точку OTLP в панели управления Cloudflare. Для каждого места назначения вы можете указать пользовательское имя и задать пользовательские заголовки для включения API-ключей или конфигурации приложения.
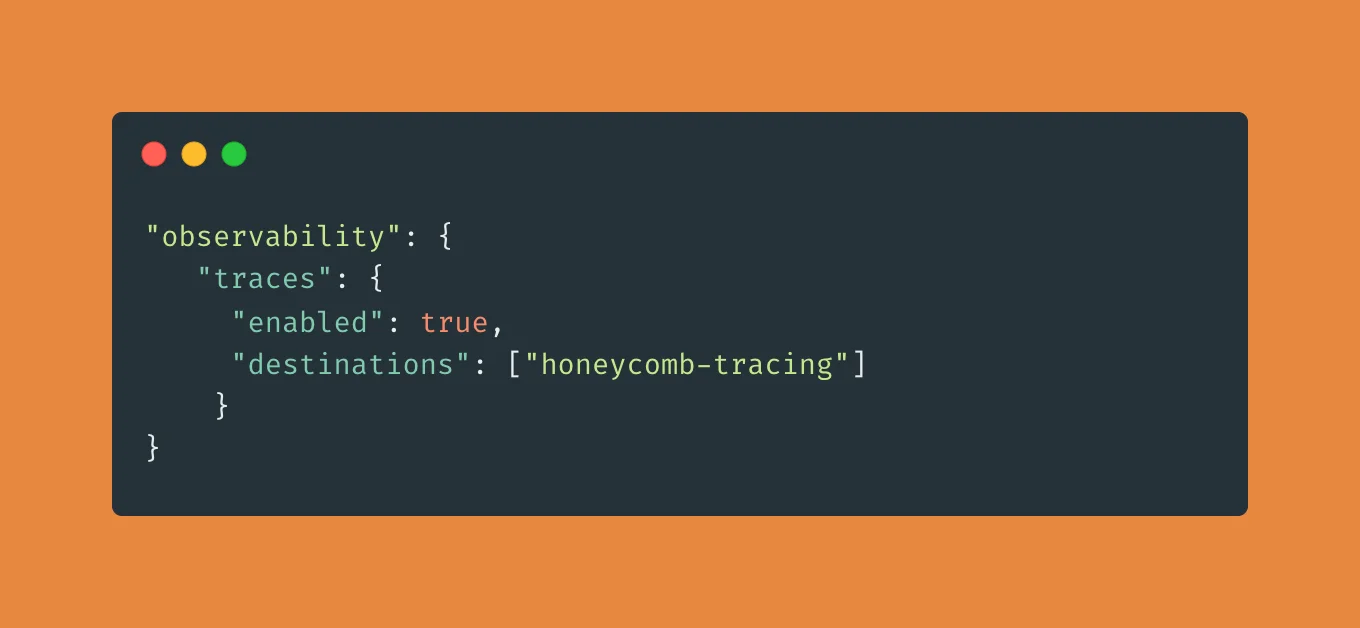
После настройки места назначения (например, honeycomb-tracing), задайте следующие параметры в вашем wrangler.jsonc и выполните развертывание:
Планы по развитию наблюдаемости Workers
Это только начало того, как Workers предоставляет рабочие процессы и инструменты для получения нужных вам данных телеметрии там, где вам это нужно. Мы улучшаем нашу поддержку как нативной трассировки в панели управления, так и экспорта других типов телеметрии сторонним поставщикам. В ближайшие месяцы мы запустим:
-
Поддержку большего количества спанов и атрибутов: Мы добавляем больше автоматических трассировок для каждой части платформы Workers. Хотя наша первоначальная цель — дать вам видимость продолжительности каждой операции в рамках вашего запроса, мы также хотим добавить детализированные атрибуты. Ваши отзывы о том, чего не хватает, будут здесь чрезвычайно ценны.
-
Распространение контекста трассировки: При создании распределенных приложений обеспечение связи ваших трассировок между всеми вашими сервисами (даже теми, что находятся за пределами Cloudflare), автоматическое связывание спанов вместе для создания полной, сквозной видимости является критически важным. Например, трассировка из Workers может быть вложена в родительскую службу или наоборот. При полной реализации наше автоматическое распространение контекста трассировки будет следовать стандартам W3C, чтобы обеспечить совместимость с вашими существующими инструментами и сервисами.
-
Поддержку пользовательских спанов и атрибутов: Хотя автоматическая инструментация дает вам видимость того, что происходит внутри платформы Workers, мы знаем, что вам также нужна видимость вашей собственной бизнес-логики. Поэтому мы предоставим вам возможность вручную добавлять свои собственные спаны.
-
Возможность экспорта метрик: Сегодня метрики, логи и трассировки доступны для мониторинга и просмотра в панели управления Workers. Но последним недостающим элементом является предоставление вам возможности экспортировать как инфраструктурные метрики (такие как объем запросов, частота ошибок и длительность выполнения), так и пользовательские метрики приложений в вашего предпочтительного поставщика услуг наблюдаемости.
Что ожидать от цен на трассировку
Сегодня, в начале бета-тестирования, просмотр трассировок в панели управления Cloudflare и их экспорт сторонним поставщикам являются бесплатными. С 15 января 2026 года за трассировки и события журналов будет взиматься плата по следующим тарифам:
Просмотр трассировок Workers в панели управления Cloudflare
Для просмотра трассировок в панели управления Cloudflare вы можете делать это на Бесплатном и Платном тарифах Workers по ценам, указанным ниже:
| Workers Бесплатный | Workers Платный | |
|---|---|---|
| Включенный объем | 200 тыс. событий в день | 20 млн событий в месяц |
| Дополнительные события | Недоступно | $0.60 за миллион логов |
| Срок хранения | 3 дня | 7 дней |
Экспорт трассировок и логов
Для экспорта трассировок в стороннее место назначения, совместимое с OTLP, вам потребуется подписка на Workers Платный тариф. Ценообразование основано на общем количестве событий спанов или логов со следующими включениями:
| Workers Бесплатный | Workers Платный | |
|---|---|---|
| События | Недоступно |
10 миллионов событий в месяц |
| Дополнительные события | $0.05 за миллион пакетных событий |
Включите трассировку уже сегодня
Готовы начать работу с трассировкой в вашем приложении Workers?
-
Ознакомьтесь с нашей документацией: Узнайте, как настроить систему, ознакомьтесь с текущими ограничениями и узнайте больше о предстоящих функциях.
-
Присоединяйтесь к обсуждению в нашем обсуждении на GitHub: Ваши отзывы будут чрезвычайно ценны в период бета-тестирования нашей автоматической инструментации, панели управления трассировкой и процесса экспорта OpenTelemetry. Перейдите в наше обсуждение на GitHub, чтобы сообщать о проблемах, подавать запросы на функции и связаться с нами!